
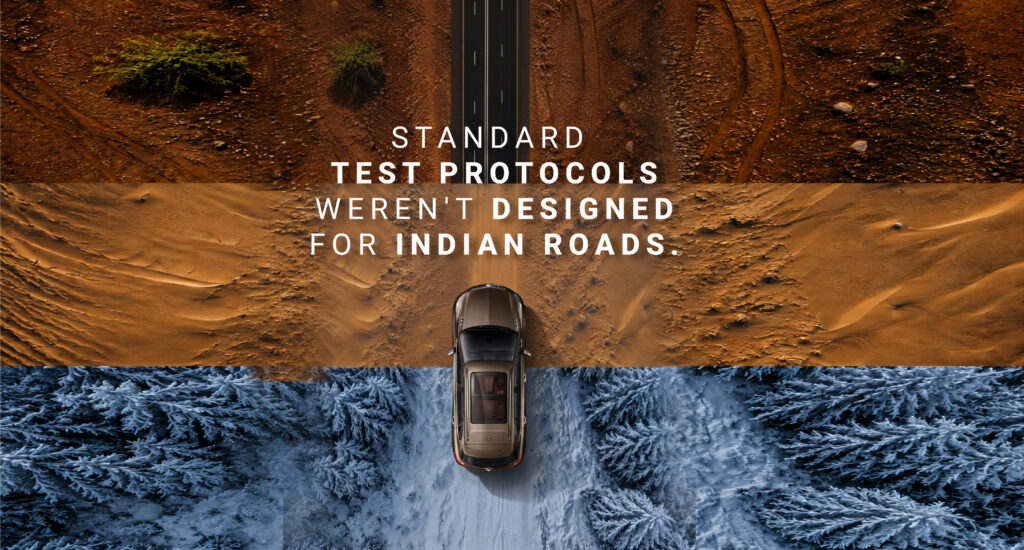
Why Indian Road Conditions Demand a Different Approach to Vehicle Validation?
Standard testing protocols were designed for European highways and Japanese expressways. Indian roads don't care about your test protocols.
Here's something that doesn't get talked about enough in automotive engineering circles:
a vehicle can pass every single validation test in a standard validation condition and still fail within eighteen months on an Indian road.
That's not a quality problem. That's a testing problem.
The global automotive validation framework was largely built around conditions found in Central Europe, North America, and Japan, smooth tarmac, well-marked lanes, predictable traffic patterns, and moderate climate variations. Those are reasonable baseline assumptions for vehicles sold in Frankfurt or Yokohama.
India is not Frankfurt. India is not Yokohama.
India is 48°C sustained heat in Rajasthan for fourteen hours straight. It's coastal humidity in Chennai that starts corroding underbody components within months. It's a speed breaker every 200 metres on a state highway. It's a pothole that didn't exist yesterday but is 15 centimetres deep today.
And yet, many validation programmes still rely heavily on standard protocols that were never designed for these conditions. The result? Vehicles that look perfect on paper but accumulate warranty claims in the field faster than anyone expected.
This blog is about that gap, the space between what standard testing catches and what Indian roads actually demand. And more importantly, how to close it.
The Indian Automotive Testing Landscape in 2026
Before we get into the technical specifics, let’s look at the market context. India’s automotive testing market was valued at approximately USD 149 million in 2024 and is projected to reach USD 244 million by 2032, growing at a CAGR of 6.3%.
India’s automotive testing market: USD 149M (2024) → USD 244M (2032) | CAGR 6.3%
But the more telling number is this: over 61% of OEM testing activities globally are now outsourced to third party laboratories and testing partners.
In India, this trend is even more pronounced. Domestic OEMs and multinational manufacturers with Indian operations are increasingly turning to specialist testing partners not because they lack internal capability, but because the volume, variety, and velocity of testing requirements have outpaced what most internal teams can handle alone.
61% of global OEM testing is now outsourced to third-party specialists
The reason is straightforward. A single vehicle programme today might require simultaneous durability validation, performance characterisation and benchmarking against three competitors, all within a programme window that’s getting shorter every year. Running these workstreams in parallel requires dedicated infrastructure, instrumentation, and programme management that most OEM internal teams simply can’t spare from their existing commitments.
The Gap Between Standard Protocols and Indian Reality
Let’s get specific. Here are the five areas where standard validation protocols consistently underestimate Indian operating conditions.
1. Temperature Extremes
Standard automotive durability protocols typically test within a range of -20°C to +45°C. That covers most of Europe, North America, and East Asia comfortably.
In India, vehicles in Rajasthan, Gujarat, and parts of Madhya Pradesh regularly operate at 48°C for sustained periods — not just peak afternoon temperatures, but continuous heat exposure for 14 or more hours during peak summer. The difference between 45°C and 48°C might seem trivial on paper. In practice, it’s the difference between a seal that lasts ten years and one that degrades in three. It’s the difference between a dashboard that stays dimensionally stable and one that warps enough to create an audible rattle. Components validated at 45°C may pass every test. At 48°C sustained for 1,000+ hours, they tell a different story.
2. Road Surface Stress
Standard proving ground tests use controlled surface profiles, Belgian blocks, cobblestones, and measured undulations designed to simulate road roughness. These profiles are valuable baseline tools, but they don’t capture the reality of Indian road surfaces.
Indian roads present a unique combination of stresses that no single standard profile addresses: unmarked speed breakers that vary in height from 5cm to 20cm, sometimes within the same stretch. Potholes that appear overnight during monsoon season. Transitions from paved highway to unpaved service road that impose sudden shock loads on suspension components. Gravel stretches that generate sustained high-frequency vibration at speeds where the driver doesn’t think to slow down.
Our experience suggests that suspension components on actual Indian roads face stress levels approximately 2.5 to 3 times higher than what standard proving ground profiles simulate. That’s not a marginal difference. That’s a fundamentally different fatigue loading condition.
Suspension stress on Indian roads: ~2.5–3× higher than standard proving ground profiles
3. Dust and Corrosion Exposure
Standard environmental testing uses salt spray chambers and controlled humidity cycling. These tests are well-established and effective for simulating coastal and industrial conditions common in Europe and East Asia.
Indian conditions add layers that standard protocols don’t fully address. Coastal regions like Chennai, Mumbai, and Kerala combine salt-laden humidity with industrial particulate matter in concentrations that accelerate underbody corrosion faster than salt spray alone. Construction dust in rapidly developing urban areas creates abrasive conditions that affect seals, filters, and exposed rubber components. Monsoon conditions introduce standing water exposure that standard splash testing doesn’t replicate, vehicles regularly wade through 15 to 30 centimetres of water during heavy rain in urban areas.
We’ve seen underbody corrosion begin within 18 months on vehicles that passed standard environmental testing not because the testing was wrong, but because the testing conditions didn’t match the operating environment.
4. Thermal Cycling and Stop-Start Conditions
Urban driving in Indian cities like Bangalore, Delhi, and Hyderabad imposes a thermal cycling pattern that differs substantially from highway-biased duty cycles used in most validation programmes. Average speeds in peak urban traffic are 8 to 12 km/h, with frequent full stops. This creates continuous low-speed thermal cycling on brake components, transmission systems, and cooling circuits that highway-biased duty cycles undercount.
Brake pads and rotors validated against European or North American duty cycles may show unexpected wear patterns in Indian urban conditions not because the materials are deficient, but because the thermal loading profile is different. The same applies to clutch assemblies in manual transmission vehicles, which see higher engagement cycles per kilometre in Indian traffic than in virtually any other market.
5. Load Conditions
This one is difficult to address diplomatically, but it’s too important to ignore. Vehicles in India are frequently loaded beyond their designed capacity, whether that’s a compact sedan carrying six adults instead of five, a commercial vehicle loaded 20% above its rated payload, or a two-wheeler carrying three passengers. Validation programmes that test only at rated capacity miss the fatigue conditions that vehicles actually experience in the field.
This doesn’t mean validation should encourage overloading. It means that a realistic assessment of how vehicles are actually used in India should inform the test matrix, particularly for suspension, braking, and structural components.
The Three Pillars of India-Specific Validation
Closing the gap between standard protocols and Indian reality requires a validation approach built on three pillars. Each one addresses a different question, and all three are necessary.
Pillar 1: Durability Testing — Does the Vehicle Survive?
Durability testing answers the most fundamental question: will this vehicle last? In the Indian context, that means testing full vehicle endurance not just against standard road profiles, but against data captured from actual Indian road surfaces through Road Load Data Acquisition (RLDA).
RLDA-driven durability testing uses accelerometer and strain gauge data recorded from real Indian roads. National Highways, state roads, urban stretches, and rural routes, to create test profiles that replicate actual operating conditions. This means the test rig doesn’t simulate a theoretical road surface. It replays the exact forces a vehicle would experience on the road between Chennai and Coimbatore, or between Delhi and Jaipur.
Component-level fatigue testing follows the same principle: suspension arms, engine mounts, axles, and bushings are tested at cyclic loads derived from Indian road data, not European standard profiles. The failure modes revealed in India-specific fatigue testing are often different from those found in standard testing different locations, different crack propagation paths, different time-to-failure distributions.
Pillar 2: Performance Testing – How Does the Vehicle Behave?
Performance testing characterises vehicle behaviour under controlled conditions: acceleration, braking, handling, ride quality, and dynamic response. These are well-established test methodologies with global standards.
Where India-specific performance testing adds value is in the conditions under which these tests are run. Brake performance at 48°C ambient temperature is different from brake performance at 25°C. Ride comfort over a road surface with speed breakers every 200 metres is a different engineering challenge from ride comfort on a smooth highway. Handling characteristics at the typical Indian highway speed of 80 to 100 km/h involve different trade-offs than handling optimised for 130+ km/h Autobahn cruising.
Performance data collected under India-relevant conditions gives engineering teams actionable information not just what the vehicle can do, but what it will do in the conditions where customers actually drive it.
Pillar 3: Benchmarking – Is It Good Enough?
This is the pillar that’s most frequently cut when programme budgets get tight. And it’s the one that costs the most when it’s missing.
Durability testing tells you if the vehicle survives. Performance testing tells you how it behaves. Benchmarking tells you whether both are good enough compared to the competition and the market expectation.
Without benchmarking, ‘good enough’ is a guess. A braking distance of 38 metres at 100 km/h means nothing in isolation. Benchmarking tells you that the top three competitors in your segment stop in 35 metres. That 3-metre gap might not affect durability or basic performance metrics, but it could cost a safety rating star. And a missing star costs market share.
Benchmarking against Indian conditions adds another dimension: how does your vehicle compare to competitors not just on a test track, but on the roads where your customers actually drive? A vehicle might benchmark well on European metrics and poorly on Indian ones or vice versa. Without India-specific benchmarking data, you don’t know which situation you’re in.
What to Look for in a Vehicle Validation Partner?
Here are the questions that separate a testing vendor from a validation partner.
Can they run durability, performance, and benchmarking in parallel?
If workstreams queue sequentially, the programme timeline stretches. Ask about infrastructure capacity, not just capability.
Do they have India-specific road load data?
RLDA data from Indian roads is not the same as standard proving ground profiles. A partner with existing Indian road data can start testing faster and test more accurately.
Do they deliver documentation in your format?
If your internal reviewers spend two weeks reformatting a testing partner’s reports, that’s not a partner that’s extra work. Sign-off documentation should match your internal templates from Day 1.
Is there a single programme manager?
‘You’ll deal with our team’ means nobody is accountable. A named programme manager with automotive validation experience is non-negotiable for any serious programme.
Can you visit the facility this week?
If the answer is anything other than ‘yes,’ that tells you everything you need to know.
The Standard Is the Starting Point. Indian Conditions Are the Finish Line.
Standard validation protocols are valuable. They provide a globally consistent baseline that ensures minimum quality, safety, and reliability across markets. No one is suggesting they should be discarded.
But they’re the starting point, not the finish line.
For any vehicle destined for Indian roads, the finish line is validation against the actual conditions those roads present: the heat, the dust, the corrosion, the surfaces, the traffic patterns, the loading conditions, and the regulatory requirements that are unique to this market.
The testing infrastructure exists. The methodologies exist. The data exists. The question is whether the programme plan allocates time and resources for India-specific validation or whether it relies on standard protocols and hopes for the best.
In our experience, the programmes that avoid field surprises are the ones that benchmark against actual operating conditions, not regulatory minimums. Not outdated test protocols. Not best-case scenarios.
Real roads. Real weather. Real duty cycles.
That’s where validation earns its name.
About Fedrus Automotive Solutions
Fedrus Automotive Solutions operates from its dedicated testing centre in Tiruvallur, Tamil Nadu, providing durability testing, performance testing, and vehicle benchmarking services to OEMs and Tier-1 suppliers. All three validation pillars run under a single programme manager, with documentation delivered in your sign-off format from Day 1. VBOX 4 data acquisition equipment is available for rental across India on daily, weekly, and monthly terms.
For programme enquiries: +91 99947 93168 | jeyanaveen.c@fedrusglobal.com
Sources:
v Market Reports World, Automotive Testing Market Trends, 2026
v AB Dynamics, India’s 2026 Heavy Vehicle ADAS Mandate, 2026